Analysis of Student Work for High School Geometry Congruent Triangles Unit
I chose to create a short answer pre-test and post-test based on the multiple choice tests my CT already had created. The problems I used were the same as hers but I modified them to allow room for explanation. I got the idea to do this from the Assessment and Evaluation Standards on NCTM’s website.
Creating an accurate way to assess and evaluate learners’ understanding was difficult. I ended up creating a framework that I could base student answers on. Then, for the post-test I used the same framework but I added one point if they showed any growth from between the two tests. So, if a learner answered the question on both tests at a level 2 but showed significantly more understanding on the post test, I added one point, so their overall score would be a 3 for that question.
Evaluating the results took some time. After I finished assessing all of the scores, I entered the data into the statistical program R. The explanation of my findings and how I was able to show growth is summarized on the data page, shown below. Further, I decided to look at the unit test in comparison to the growth model and I found about four outliers on the unit test, which was the same number I found on the growth model. Overall, I was able to accurately model growth and compare it to the results of the unit test.
- Pre-Test: http: http://www.scribd.com/doc/94479211/Pre-Test
- Post Test: http: http://www.scribd.com/doc/94479203/Post-Test
- Assessment Scoring Framework: http://www.scribd.com/doc/94479205/Pre-Post-Scoring
- Student Work for Pre-Test & Post-Test: http://www.scribd.com/doc/94479207/PRE-POST-Student-Work
- Pre and Post Test Student Scores: http://www.scribd.com/doc/94480366/Pre-Post-Score-Breakdown
- Unit Test Scores compared to Growth Model Scores: http://www.scribd.com/doc/94483925/Unit-Scores-Comparison
- R-code: http://www.scribd.com/doc/94481602/3rd-Macro-R-Code
- Explanation of Findings: http://www.scribd.com/doc/94470350/3rd-Macro-Synopsis
- Figures of Findings (Graphs): http://www.scribd.com/doc/94470332/3rd-Macro-Graphs
Explanation of Findings
This data reflects the learners' growth after concluding Chapter 4: Congruent Triangles.
PURPOSE:
I was interested in seeing if the mean score on the post test would be higher than it was on the pre-test.
METHOD:
Each student was given a pre-test before the unit and then a post test following the unit. The questions on each test were the same with exception to the final question. The data is given below.
DATA:
Students: 1 2 3 4 5 6 7 8 9 10 11 12 13 14 15 16 17 18 19 20 21 22 23 24 25 26
PRE-TEST SCORES: 5,4,6,1,8,5,6,7,6,7,5,4,6,10,5,2,5,6,6,6,6,7,2,5,4,6
POST-TEST SCORES: 8,15,14,8,11,9,10,14,12,13,12,13,19,16,13,9,12,15,14,17,11,9,10,17,8,17
QUESTIONS CONSIDERED:
The Procedure:
I analyzed the differences between the two dependent samples (pre-test and post-test) using R and then explained my findings.
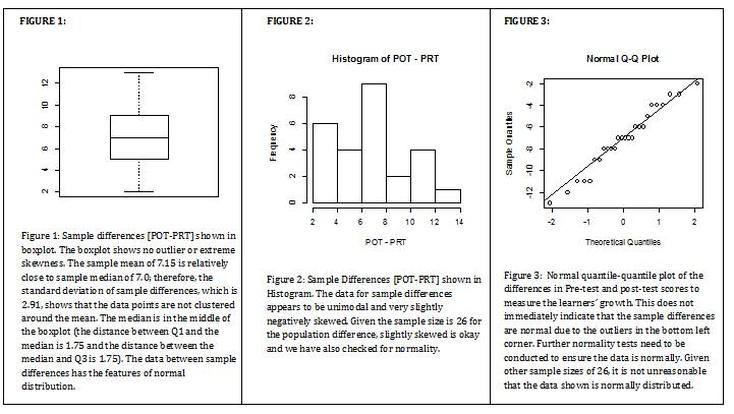
Using R I found the differences between the two samples is: PRT-POT [3 11 8 7 3 4 4 7 6 6 7 9 13 6 8 7 7 9 8 11 5 2 8 12 4 11]. Also, the sample mean of the differences is 7.15 and the sample standard deviation of the difference is 2.907814. I used the qqnorm(POT-PRT) and qqline(POT-PRT) to analyze the sample differences in quantile-quantile plot form {See FIGURE 3}. Based on Figure 3, it is not immediately clear that the distribution of differences is normal due to the outliers in the bottom left corner, however, for a sample size of the 30, the results show that it is not unreasonable to assume the distribution of differences between PRT and POT follow a normal distribution.
To statistically test the spread of the data, I used variance and constructed a 95% confidence interval for the ratio of population variances. After running the variance test, I found that I was 95% certain that the ratio of variances falls in the following interval: [.16, .78], which indicates that a pooled variance could be justified for confidence interval calculations regarding the means. Therefore, this finding showed that the data is normal, and since standard deviation as a measure of spread is dependent on whether the mean and standard deviation are from a normal distribution, I was able to conclude my calculations for mean and standard deviation are correct. I also ran a Shapiro.Wilk normality test for relatively small samples because my sample size is thirty, which is relatively small. I found that P=.54 and since the test statistic was clearly significant at P = 0.05, I concluded .54>.05, which accepts the null hypothesis that the data is from a normal distribution.
Since I established the data is normally distributed, I ran a Paired T-Test. This test shows that the 95% confidence interval is 5.979 to 8.328. This is implies that I am confident that the test scores' sample mean of differences lies within the confidence interval: [5.979, 8.328]. As stated above, I found the sample mean of differences to be 7.15 and 7.15 clearly lies in the confidence interval; therefore, using my findings, I can conclude that I am 95% confident that the true sample mean of differences between POT and PRT populations is between 5.98 and 8.33 units. Since the confidence interval does not contain zero I know that the data is significantly different; which implies that the post test score reflects new learning and is greater than the pre-test score. This data ensures that the students learned new information during Chapter 4.
I was interested in seeing if the mean score on the post test would be higher than it was on the pre-test.
METHOD:
Each student was given a pre-test before the unit and then a post test following the unit. The questions on each test were the same with exception to the final question. The data is given below.
DATA:
Students: 1 2 3 4 5 6 7 8 9 10 11 12 13 14 15 16 17 18 19 20 21 22 23 24 25 26
PRE-TEST SCORES: 5,4,6,1,8,5,6,7,6,7,5,4,6,10,5,2,5,6,6,6,6,7,2,5,4,6
POST-TEST SCORES: 8,15,14,8,11,9,10,14,12,13,12,13,19,16,13,9,12,15,14,17,11,9,10,17,8,17
QUESTIONS CONSIDERED:
- What is the population of interest? High School Students in Geometry A studying Chapter 4
- What is the parameter of interest? The population mean difference between Pre-Test scores and Post Test scores for chapter 4. What is its value? unknown (population mean between sample differences, but it would be impossible to test everyone who learners about Congruent Triangles, that is why the value is unknown).
- What is the statistics of interest? The sample mean difference between the two dependent samples: Pre-Test scores before learning about Congruent Triangles and Post Test scores after learning about congruent triangles. What is its value? 7.15
- Obtain the 95% confidence interval of the parameter of interest? [5.979,8.328] We are 95% confident that the true sample mean of differences between the pre-test and post test populations is between 5.979 and 8.328 units.
The Procedure:
I analyzed the differences between the two dependent samples (pre-test and post-test) using R and then explained my findings.
Using R I found the differences between the two samples is: PRT-POT [3 11 8 7 3 4 4 7 6 6 7 9 13 6 8 7 7 9 8 11 5 2 8 12 4 11]. Also, the sample mean of the differences is 7.15 and the sample standard deviation of the difference is 2.907814. I used the qqnorm(POT-PRT) and qqline(POT-PRT) to analyze the sample differences in quantile-quantile plot form {See FIGURE 3}. Based on Figure 3, it is not immediately clear that the distribution of differences is normal due to the outliers in the bottom left corner, however, for a sample size of the 30, the results show that it is not unreasonable to assume the distribution of differences between PRT and POT follow a normal distribution.
To statistically test the spread of the data, I used variance and constructed a 95% confidence interval for the ratio of population variances. After running the variance test, I found that I was 95% certain that the ratio of variances falls in the following interval: [.16, .78], which indicates that a pooled variance could be justified for confidence interval calculations regarding the means. Therefore, this finding showed that the data is normal, and since standard deviation as a measure of spread is dependent on whether the mean and standard deviation are from a normal distribution, I was able to conclude my calculations for mean and standard deviation are correct. I also ran a Shapiro.Wilk normality test for relatively small samples because my sample size is thirty, which is relatively small. I found that P=.54 and since the test statistic was clearly significant at P = 0.05, I concluded .54>.05, which accepts the null hypothesis that the data is from a normal distribution.
Since I established the data is normally distributed, I ran a Paired T-Test. This test shows that the 95% confidence interval is 5.979 to 8.328. This is implies that I am confident that the test scores' sample mean of differences lies within the confidence interval: [5.979, 8.328]. As stated above, I found the sample mean of differences to be 7.15 and 7.15 clearly lies in the confidence interval; therefore, using my findings, I can conclude that I am 95% confident that the true sample mean of differences between POT and PRT populations is between 5.98 and 8.33 units. Since the confidence interval does not contain zero I know that the data is significantly different; which implies that the post test score reflects new learning and is greater than the pre-test score. This data ensures that the students learned new information during Chapter 4.
Graphical Representations of the Data
ggggggg
